Book review The Climate Casino by Nordhaus
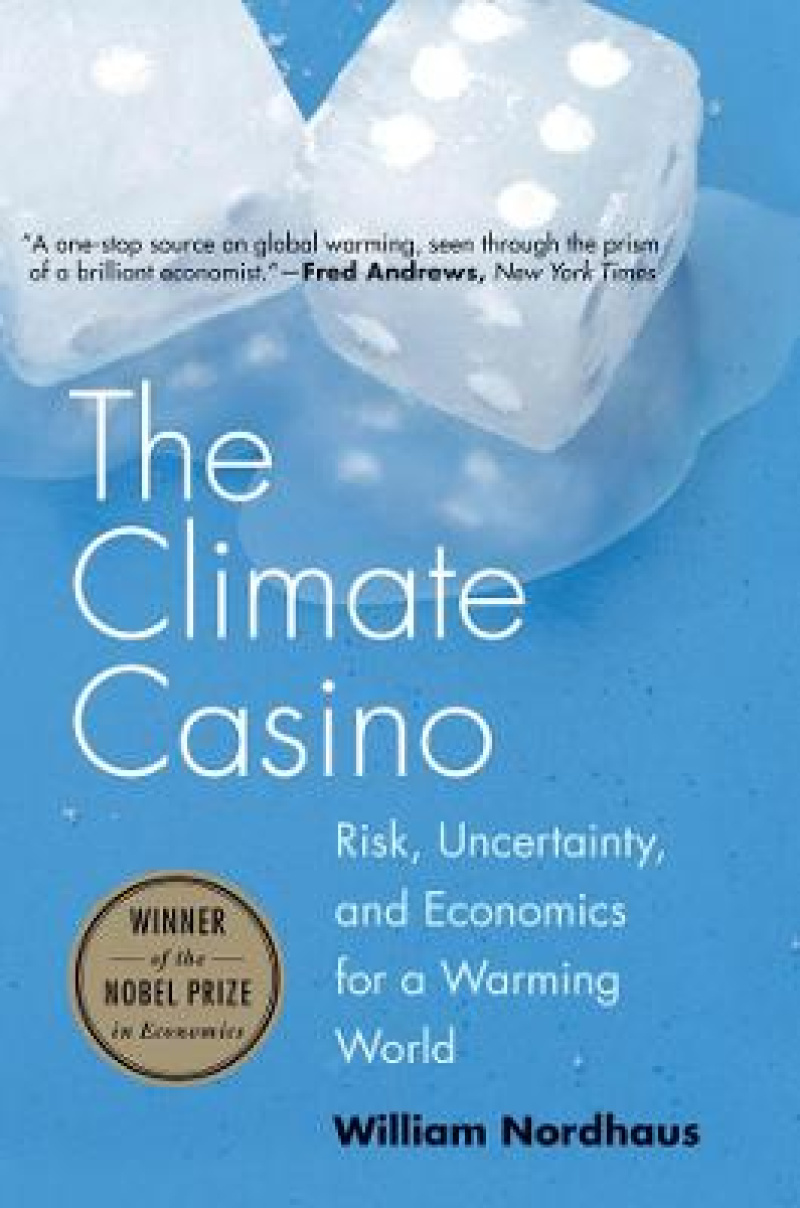
Excellent primer on climate economics from one of the founders, as well as most distinguished researcher in this field of economics. Nordhaus explains even the most fundamental concepts of economics (eg. discount rate, cost-benefit, opportunity cost) in order to make sure that everyone is able to follow his reasoning on finding the most efficient tax regime for reducing GHG emissions.
Its 20 years since I first read books citing Nordhaus’ DICE model for calculating the net costs of climate (in-)action. After he received a Nobel price in economics for his work on the DICE model, I felt it was time to read this own pop.science book on his research field, instead of relying on other authors praise or his (often unfair) criticism from his opponents.
Highlights
An important approach for analysis of climate change is a class of integrated assessment models (IAMs). These are comprehensive models that include not only climate but other aspects of the science and economics of climate change.
— location: 446 ^ref-33558
DICE is short for Dynamic Integrated model of Climate and the Economy. There is also a more elaborate Regional version, known as the RICE model.
— location: 456 ^ref-406
Current concentrations of CO2 far exceed the levels observed for at least 650,000 years.
— location: 742 ^ref-44336
The bottom line is that if no policies are made to slow global warming, the central estimate is that the average global temperature by 2100 will be about 3½°C above the 1900 level.
— location: 767 ^ref-62404
With that background, four global-scale tipping elements are of particular concern: • The collapse of large ice sheets • Large-scale changes in ocean circulation • Feedback processes by which warming triggers more warming • Enhanced warming over the long run
— location: 862 ^ref-60174
The most important tipping points, in their view, have a threshold temperature tipping value of 3°C or higher (such as the destruction of the Amazon rain forest) or have a time scale of at least 300 years (the Greenland Ice Sheet and the West Antarctic Ice Sheet). Their review finds no critical tipping elements with a time horizon less than 300 years until global temperatures have increased by at least 3°C.
— location: 931 ^ref-62099
Measurements of the GIS indicate that it was stable for most of the twentieth century but began to shrink during the last two decades. The current melt rate is estimated to be 0.75 mm (0.03 inch) per year of sea-level rise equivalent (SLRe). Recent estimates suggest that the GIS will contribute a small amount to SLRe over the next century; a central
— location: 942 ^ref-3285
The central finding here is that the climate-change problem is largely a by-product of rapid economic growth without emissions reductions. But the scenario of continued productivity growth also implies that people will on average be richer in the future—which in turn implies that nations will be better able to afford steps to slow climate change or adapt to its adverse effects.
— location: 1208 ^ref-60227
The appropriate response is to fix the market failure by repairing the flawed economic externality involved in climate change.
— location: 1220 ^ref-61312
the IPCC Fourth Assessment Report, which provided a careful review by experts in the field. Globally, the potential for food production is projected to increase with increases in local average temperature over a range of 1–3°C, but above this it is projected to decrease. Increases in the frequency of droughts and floods are projected to affect local crop production negatively, especially in subsistence sectors at low latitudes. Adaptations such as altered cultivars and planting times allow low-and mid-to high-latitude cereal yields to be maintained at or above baseline yields for modest warming.
— location: 1232 ^ref-4122
In the case without adaptation or CO2 fertilization, yields begin to decline after local warming of around 1½°C. However, the story is quite different with adaptation and CO2 fertilization. Wheat yields in low-latitude regions with adaptation would be positive for temperature increases up to 3°C. This is the climate change that would be expected late in this century. Yields would begin to decline after the 3°C change and would decline as much as 30 percent at a 5°C temperature increase. The same survey found that the break-even temperature change for rice in low-latitude regions is estimated to be 4°C.
— location: 1278 ^ref-20763
The health risks from climate change shown in Table 3 can be evaluated in the context of the overall health improvements in developing countries. Take sub-Saharan Africa as an example. For this region, life expectancy has increased about 10 years over the last four decades. The upper-bound health losses from climate change shown in Table 3 are about 1 year of life expectancy per person over the next four decades. This implies that the health risks from climate change are equivalent to a loss in health improvements of about four years at historical rates. In other regions, the losses are estimated to be much smaller.
— location: 1428 ^ref-18157
While people tend to believe that poor countries are most likely to be affected, that is not accurate for SLR. The United States is highly vulnerable, while Canada is not. Bangladesh is vulnerable, while Chad is not. A careful look at the data shows that low-elevation regions tend to have higher per capita income than high-elevation regions.
— location: 1648 ^ref-16002
The chemistry is relatively straightforward. When CO2 dissolves in the oceans, it makes the oceans more acidic and lowers the concentrations of calcium carbonate.17 Many marine organisms form shells from calcium carbonate, including corals, mollusks, crustaceans, and some plankton. Because climate change and ocean acidification are both caused by increasing atmospheric CO2, acidification is sometimes referred to as “the other CO2 problem.”
— location: 1702 ^ref-13132
Ocean acidification has several important features. First, it depends primarily on the carbon cycle and does not have the uncertainties associated with climate modeling. Either because the chemistry is hard to challenge, or because the trend is clear, there is little controversy about ocean acidification. I have not yet read that ocean acidification is a hoax. Second, the entire phenomenon was only recently recognized. The first major publications appeared over the past decade.18 Indeed, the biological problems of acidification were not even recognized in the IPCC Third Assessment Report of 2001. This is a sobering example of what we call “inevitable surprises.”
— location: 1707 ^ref-38921
There is evidence of a sharp increase in ocean CO2 during an episode known as the Paleocene-Eocene thermal maximum (PETM), 55 million years ago. Based on data from earlier episodes of spiking CO2 like the PETM, it appears that most species survived, but we should expect the current increase in CO2 to result in the extinction of some species.
— location: 1722 ^ref-9785
Humans are likely to add at least 3 to 4 trillion tons of CO2 to the upper layer of the oceans by 2100.
— location: 1730 ^ref-1095
these changes will cause. You are unlikely to see a video on the rising sea because the rise is imperceptible.
— location: 1740 ^ref-32297
You are unlikely to see a video on the rising sea because the rise is imperceptible. In most places, tidal changes over a few hours are larger than sea-level rise over the next century.
— location: 1740 ^ref-33621
Hurricanes caused damages that averaged 0.05 percent of GDP per year over this period, with the maximum being 1.3 percent of GDP in 2005 (the spike there is produced primarily by Hurricane Katrina).
— location: 1760 ^ref-23110
The effect of global warming on tropical cyclones has been studied carefully, and the basic physics is clear. Global warming may affect several dimensions of hurricanes, including frequency, size, intensity, duration, and geographic distribution. Of the five, the only clear link from basic physics is between global warming and intensity. As sea surface temperature rises, the “potential intensity” or upper limit of wind speed increases, holding other factors constant. Recent calculations suggest that a warming of 4°C would increase the average intensity by about one category (say, from a category 2 to a category 3 hurricane, or about 16 miles per hour).
— location: 1768 ^ref-522
Another interesting finding, which is parallel to the finding on sea-level rise in Chapter 9, is that hurricane damages are only weakly correlated with affluence. The United States is heavily affected, while the impact of hurricane intensification on Africa is essentially zero. These results show again how the impacts of climate change are distributed widely and unpredictably.
— location: 1790 ^ref-22210
Only one new drug in the last three decades came from the rain forest (Taxol), and it was from a temperate rather than a tropical rain forest.
— location: 1923 ^ref-21023
These aspects were analyzed by biologists Sean Nee and Robert May. They studied how much of the genetic diversity or information coded in DNA—the tree of life, in Charles Darwin’s phrase—was lost in past extinctions. The idea is that all species are not equally important. For example, the extinction of the dodo bird, with no genetically close relatives, would lead to a greater loss in diversity than the loss of one of the 3,000 mosquito species. Their surprising finding was that approximately 80 percent of the underlying tree of life survived even when 95 percent of species were lost.
— location: 1986 ^ref-13180
We have seen that market economies of high-income countries are increasingly insulated from the vicissitudes of climate and other disturbances of nature. This is partly because the nature-based sectors such as agriculture are shrinking relative to services, and partly because nature-based sectors are becoming less dependent on unmitigated natural influences.
— location: 2020 ^ref-31906
Our estimated impacts are in the range of 1–5 percent of output for a 3°C warming. This compares to projected improvements in per capita GDP in the range of 500 to 1,000 percent over the same period for poor and middle-income countries. The loss in income would represent approximately one year’s growth for most countries spread over several decades.
— location: 2153 ^ref-56840
Economic evidence suggests that it would be relatively inexpensive to slow climate change if nations adopted efficient control strategies in a timely and near-universal fashion. The necessary steps—which involve rapidly developing new technologies and raising the price of carbon emissions as an incentive to reduce emissions—rely on economic mechanisms that have worked effectively around the world for many years.
— location: 2202 ^ref-61504
This point deserves repetition because it is so critical: The most cost-effective way to reduce CO2 emissions is to reduce the use of coal first and most sharply.
— location: 2366 ^ref-28870
A typical finding is that using inefficient regulations or approaches will double the costs of meeting environment objectives. Put this finding together with the assumption of a 50 percent participation rate. Then the cost curve in Figure 26 would shift upward by a factor of 2.
— location: 2687 ^ref-2160
The discounting controversy has centered primarily on the question of whether the discount rate should be derived from a prescriptive (normative) approach, or whether it should rely upon a descriptive (opportunity-cost) basis.2 Begin with the prescriptive approach. This approach was forcefully advocated by the distinguished British economist Nicholas Stern, in a major study he led on climate-change policy, the Stern Review. Along with others, Stern argued that it is unethical to discount the welfare of future generations. They believe that we should therefore apply a very low discount rate on goods to calculate the present value of future climate damages. Advocates of the normative view often advocate discount rates on goods around 1 percent per year.3 An alternative approach based on sustainability has been developed by Yale political scientist John Roemer.
— location: 2781 ^ref-15252
the relative valuations of the consumption of rich and poor generations.4
— location: 2797 ^ref-53890
Here is a different way of seeing this point. Most philosophers and economists hold that rich generations have a lower ethical claim on resources than poor generations. This would imply that we would discount the value of future consumption relative to today’s consumption because we think that future generations will be richer than present generations. Exactly how high the discount rate on goods should be would depend upon how much richer future generations are expected to be as well as the relative valuations of the consumption of rich and poor generations.
— location: 2793 ^ref-50668
We need to use a discount rate that reflects the actual market opportunities that societies face, not an abstract definition of equity taken out of the context of market realities. The logic of market discounting is not just a selfish view that the future should take care of itself. It does not hold that we should consume all our income and make no investments to protect our world or future generations
— location: 2902 ^ref-24884
We need to use a discount rate that reflects the actual market opportunities that societies face, not an abstract definition of equity taken out of the context of market realities. The logic of market discounting is not just a selfish view that the future should take care of itself. It does not hold that we should consume all our income and make no investments to protect our world or future generations.
— location: 2902 ^ref-50018
The surprising answer is that the scientific rationale for the 2°C target is not really very scientific.
— location: 2980 ^ref-33757
The second rationale for the 2°C target is based on ecological arguments. According to an advisory group to the World Meteorological Organization in 1990, a global warming of 2°C would be “an upper limit beyond which the risks of grave damage to ecosystems, and of nonlinear responses, are expected to increase rapidly.” There was relatively little support for this statement at that time. Several of these ecological problems are discussed earlier in this book (see the impact analysis in Part II). They do appear to worsen with more rapid climate change, but there is no clear threshold at any specific level of warming.
— location: 3024 ^ref-22572
precautionary principle. This principle is used in many different areas. In 1992, the United Nations’ Rio Declaration on Environment and Development stated, “Where there are threats of serious or irreversible damage, lack of full scientific certainty shall not be used as a reason for postponing cost-effective measures to prevent environmental degradation.”7 A more radical statement is that in the absence of scientific certainty, society should make policies that would prevent the worst outcome (a “minimax” strategy in game theory).
— location: 3202 ^ref-14520
Political scientists point out that the public acceptability of a price-raising regulation or tax may be affected by the point in the production chain at which it is levied. “The only good tax is an invisible tax,”
— location: 3326 ^ref-29191
In the environmental area, the most successful example is the use of allowances to limit the emissions of sulfur dioxide (SO2) since 1990. This program proved very successful in reducing overall emissions and did so much less expensively than many analysts had predicted. The U.S. SO2 program was so successful that it was used as the basis for the Kyoto Protocol’s GHG emissions plan and then for the European Union’s CO2 Emissions Trading Scheme.
— location: 3487 ^ref-19971
Carbon taxes have two major disadvantages relative to cap-and-trade systems. The first is that the quantity of emissions is uncertain under a carbon tax. If we set a universal carbon tax of $25 per ton, we would not know the actual quantity of emissions. If we have a definite idea of a dangerous level of emissions, this would be a major disadvantage of carbon taxes.
— location: 3565 ^ref-47568
Another set of questionable proposals is to subsidize “green energy” or “green jobs.” The spirit of these proposals is that certain activities are low carbon and should be encouraged. However, we always need to look behind the “green” label to determine whether that is really a cover for politically favored but inefficient subsidies such as the one for ethanol described earlier.
— location: 3964 ^ref-27720
I recalculated the economic impacts of waiting using the DICE-2012 model to determine the cost of delaying action for 50 years. The loss is calculated as $6.5 trillion. Waiting is not only economically costly but will also make the transition much more costly when it eventually takes place.
— location: 4445 ^ref-49329
On reflection, I recognize that this argument fundamentally misunderstands the economic rationale of carbon taxes. Those who burn fossil fuels are enjoying an economic subsidy—in effect, they are grazing on the global commons and not paying for what they eat. Raising the carbon price would improve rather than reduce economic efficiency because it would correct for the implicit
— location: 4662 ^ref-28770
this argument fundamentally misunderstands the economic rationale of carbon taxes. Those who burn fossil fuels are enjoying an economic subsidy—in effect, they are grazing on the global commons and not paying for what they eat. Raising the carbon price would improve rather than reduce economic efficiency because it would correct for the implicit subsidy on the use of carbon fuels. European countries have found that they can levy energy taxes, reduce taxes on labor and other worthwhile activities, reduce CO2 emissions, and improve overall economic performance.
— location: 4662 ^ref-46737
Earth: The Operators’ Manual (New York: Norton, 2011); Stephen H. Schneider, Armin Rosencranz, Michael D. Mastrandrea, and Kristin Kuntz-Duriseti, eds., Climate Change Science and Policy
— location: 4898 ^ref-18006